↑
The 2-Hour Cloudflare Collapse: What a Database Query Taught Us About Internet Fragility
On November 19, 2025, a significant portion of the internet experienced widespread disruption when Cloudflare – one of the world’s largest content delivery networks and DDoS protection providers – suffered a major outage. What initially appeared to be a sophisticated attack turned out to be something far more mundane: a poorly constructed database query. As someone who has spent years working with network infrastructure and supporting businesses through technical challenges at InterLIR, I’ve witnessed firsthand how critical reliable internet connectivity is for modern enterprises. This incident offers valuable insights into the fragility of internet infrastructure and the cascading effects that can occur when core systems fail – lessons that are particularly relevant for organizations managing their own network resources, including IPv4 address allocations.
📑 Quick Navigation
Understanding the Incident
Provider Comparison & Strategy
Business Impact & Action Items
What Actually Broke: The 90-Second Explanation
A malformed ClickHouse database query doubled bot detection file sizes beyond system limits, crashing Cloudflare’s global proxy network every 5 minutes for 2 hours on November 19, 2025.
The technical chain reaction started innocuously enough. Engineers updated database permissions to grant users access to both data and metadata – a routine operation that happens in production environments everywhere. But mistakes in the query construction caused it to return excessive information. Not wrong information, just way too much of it. These bloated “feature files” got distributed to every edge server worldwide every five minutes, creating a rhythmic pattern of crash-recover-crash that mimicked a sophisticated DDoS attack.
Here’s the thing nobody expected: the system was actually working as designed. Cloudflare’s infrastructure correctly detected corrupted files and failed safely by crashing rather than processing bad data. The problem? It kept trying again with new corrupted files every 5 minutes.
Think of it like a factory assembly line where someone accidentally doubled the size of every part. The robots don’t malfunction – they correctly identify that oversized parts won’t fit and stop the line. But if new oversized parts keep arriving every few minutes, you get stuck in a loop of start-stop-start that looks like the machinery is broken when really it’s just responding properly to bad inputs.
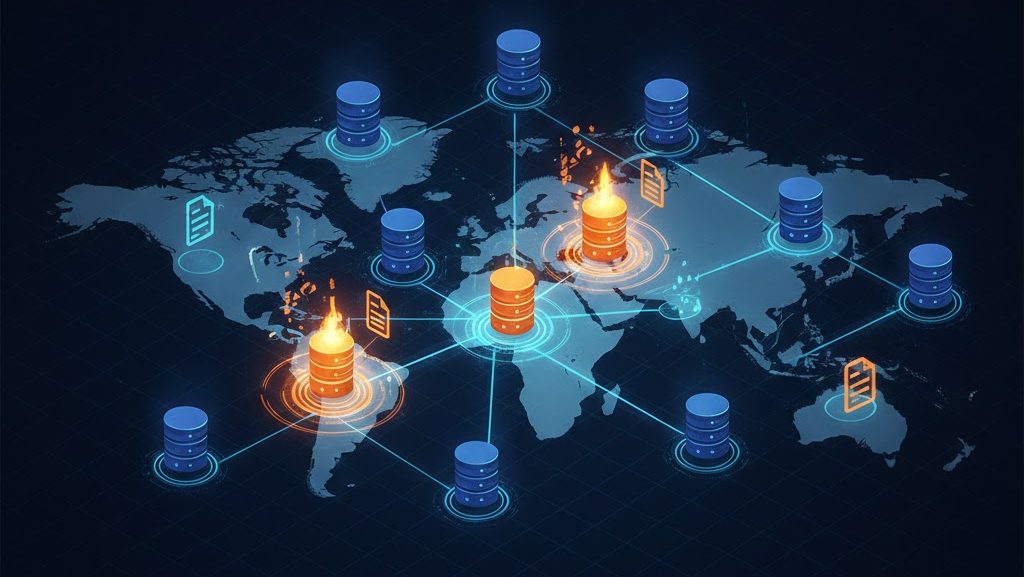
The failure cascade: a single database query affected every edge location within 5-minute cycles, creating an intermittent pattern that mimicked a DDoS attack
The One-Sentence Answer
On November 19, 2025, Cloudflare experienced a global outage affecting roughly 20% of the internet when a database permission change caused bot management files to exceed size limits, triggering repeated crashes across their proxy infrastructure.
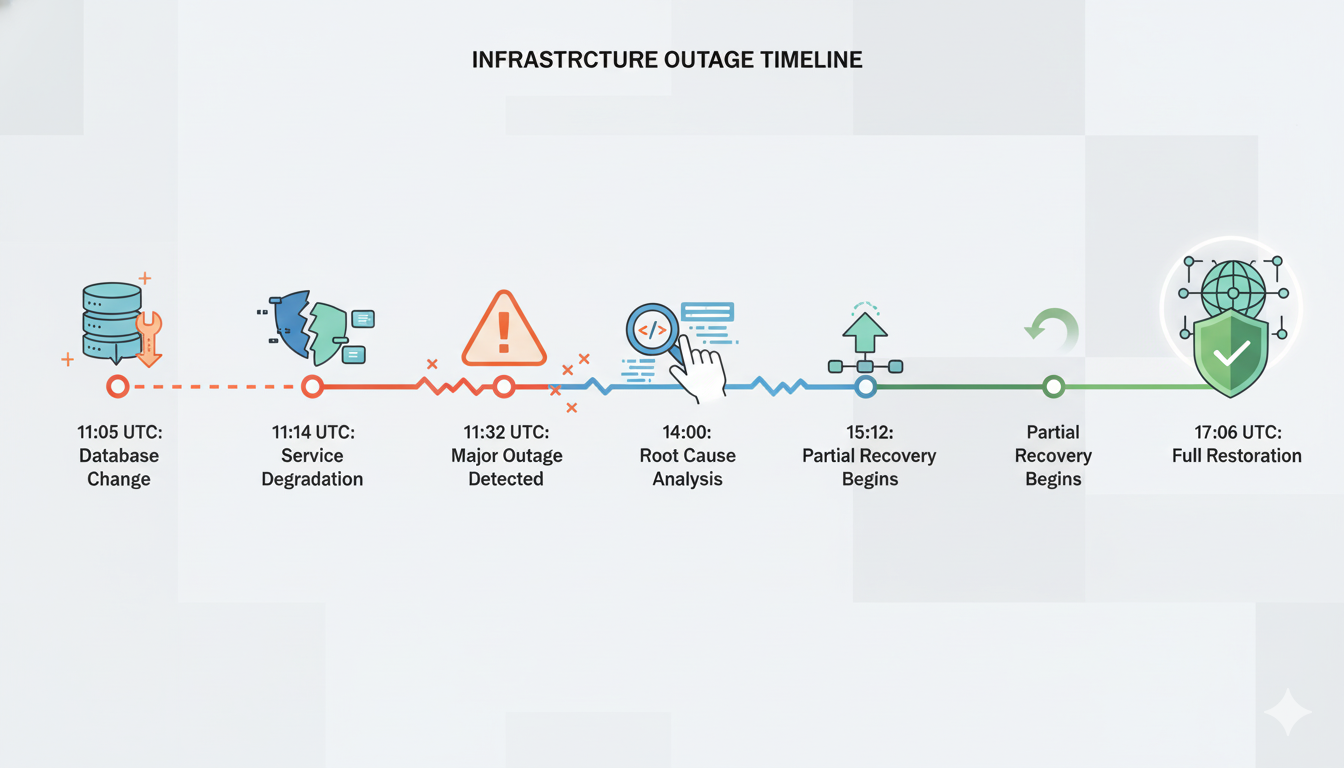
The incident lasted approximately 2 hours, from 11:20 UTC when failures began until just before 13:00 UTC when services fully stabilized. During that window, millions of websites using Cloudflare for content delivery, DDoS protection, or DNS resolution experienced intermittent failures or complete unavailability.
What made this particularly nasty to diagnose? The intermittent nature. Because only database nodes that had received the permission update were generating problematic files, the system oscillated between functioning normally and failing as new files propagated every five minutes. Engineers initially suspected a “hyper-scale DDoS attack” – the symptoms looked identical to coordinated external assault even though the cause was entirely internal.
Why This Matters for Your Infrastructure
This incident reveals three uncomfortable truths about modern internet infrastructure that extend far beyond Cloudflare specifically.
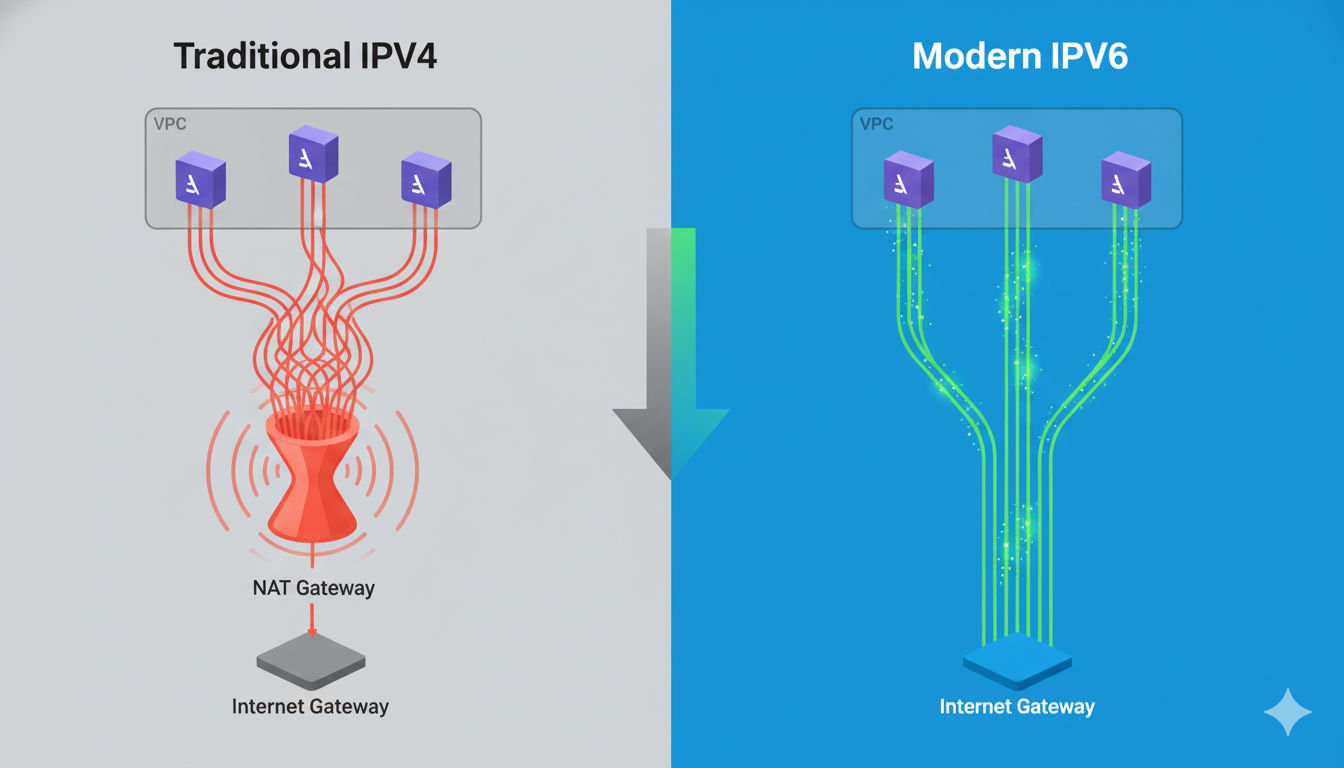
First: distributed architectures don’t eliminate single points of failure – they hide them. Cloudflare operates 300+ edge locations worldwide, making it one of the most geographically distributed networks on the planet. Yet a single database query affected every location simultaneously because they all depended on the same feature file generation system. Geographic redundancy protects against regional failures like power outages or fiber cuts. It does nothing for shared logical dependencies.
Second: the most dangerous failures come from trusted internal systems, not external attacks. Security teams obsess over preventing breaches, blocking bots, and mitigating DDoS. Those are real threats. But statistically, the outages that cause the most damage originate from configuration changes, database migrations, and deployment errors – operations performed by your own engineers. The Facebook BGP disaster in 2021? Internal change. The Fastly outage? Software bug triggered by valid customer config. Now Cloudflare? Database permission error.
Third: intermittent failures are exponentially harder to diagnose than complete system failures. When everything breaks at once, the cause is usually obvious. When systems oscillate between working and failing with no clear pattern, you waste hours chasing ghosts. The 5-minute cycle here meant that by the time engineers identified a problem, the system had recovered – only to fail again moments later.
For organizations managing their own infrastructure – whether that’s CDN services, DNS resolution, or even IPv4 address allocations at the network layer – these lessons translate directly. The question isn’t whether your provider or your systems will fail. They will. The question is whether you’ve architected redundancy for the right failure modes.
The 5-Minute Death Loop Explained
Picture a game of musical chairs where the music stops every 5 minutes and everyone tries to sit down – except someone keeps replacing half the chairs with ones that collapse immediately. That’s essentially what happened inside Cloudflare’s infrastructure.
The bot management system operated on a 5-minute refresh cycle. Every five minutes, it would: query the ClickHouse database for updated threat intelligence, generate new “feature files” containing bot detection rules, distribute those files to all 300+ edge locations worldwide, and proxy servers would load the new files and resume normal operation. This cycle worked flawlessly for years. Until the permission change.
Once the database query started returning excessive data, every new feature file exceeded the size limits that proxy servers expected. So every 5 minutes, servers across the global network would attempt to load the new files, discover they were corrupted or oversized, crash to prevent processing bad data, restart with the old cached files, work normally for 4-5 minutes, then receive the next batch of corrupted files and crash again.
The intermittent pattern created several diagnostic nightmares simultaneously. First, the failures weren’t consistent – some edge locations crashed while others continued serving traffic normally, depending on which database nodes they’d queried and whether those nodes had received the permission update yet. Second, the 5-minute periodicity mimicked coordinated attack waves. And third, because systems recovered automatically after each crash, monitoring showed a pattern of “service degradation” rather than “critical failure,” which delayed escalation to senior engineering teams.
Actually, the most insidious aspect of this failure mode? It validated itself. Each time proxy servers crashed and recovered, monitoring systems logged “potential DDoS event mitigated,” reinforcing the external attack hypothesis. The system was telling responders that it successfully defended against attacks, when in reality it was defending against itself.

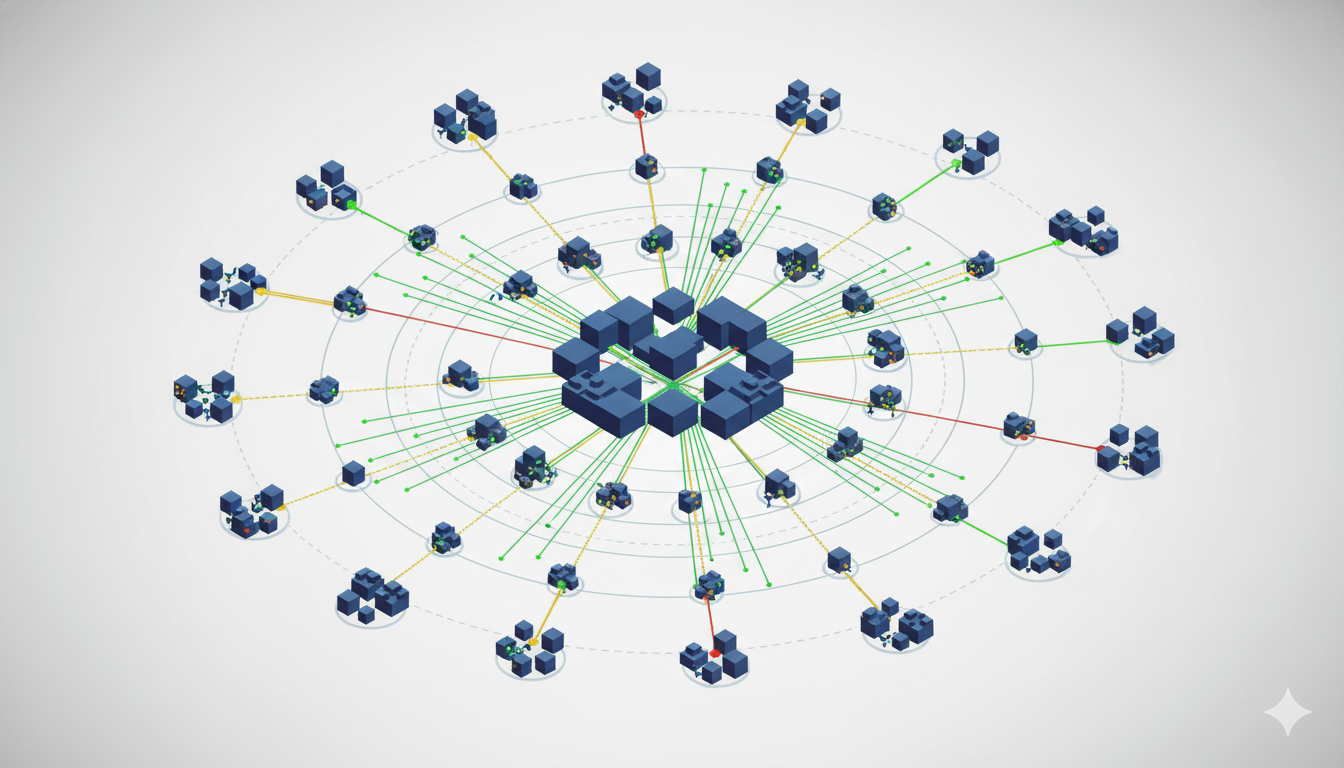
Cascading failure visualization: Cloudflare outage impact rippling through millions of connected internet services globally
Database Query Failures: Definition, Comparison, Application
🔹 DEFINITION: What are permission-based query errors?
A database permission error typically occurs when a query attempts to access data or operations it lacks authorization for – that’s the straightforward case that fails immediately with an “access denied” message. But Cloudflare’s incident was considerably more subtle. Their query had permission to access both regular data AND metadata, which it previously couldn’t see. The query wasn’t blocked – it succeeded – but returned way more information than the downstream systems were designed to handle.
Think of it like this: you ask a customer service rep for someone’s account status, and instead of getting “active” or “suspended,” you accidentally get their entire customer history file – purchase records, support tickets, payment methods, everything – because someone recently gave you access to “all account information” without realizing your system was only built to process single-field responses.
🔹 COMPARISON: How this differs from other database failures
Unlike query syntax errors (which fail immediately and obviously with parse exceptions), permission-based issues can succeed partially or return unexpected volumes without triggering any error state. The database returns HTTP 200 OK – success – even though the output is catastrophically wrong.
Unlike hardware failures (disk crashes, memory exhaustion, network partitions), the database itself was working perfectly. CPU usage normal, disk I/O healthy, replication humming along. It correctly returned all the data the query requested. You can’t detect this type of failure by monitoring database health metrics.
And unlike DDoS attacks (which overwhelm from external sources with traffic volume), this originated internally from trusted systems executing authorized operations. No unusual traffic patterns, no suspicious IPs, no rate limit violations. Just a routine query returning unexpectedly large result sets.
🔹 APPLICATION: When routine operations become catastrophic
This failure pattern appears most commonly in three specific scenarios: after permission changes (like Cloudflare encountered), during schema migrations (when queries suddenly see new columns), and with feature flags that expose new data sources. The lesson? Any change to data access patterns needs the same rigorous validation as changes to the data itself.
In practice, that means: output validation layers (check not just data types but also volume, size, and structure), canary queries (run modified queries against production data but discard results first), size limit enforcement (hard caps on query result sizes), and permission principle of least privilege (grant only the specific access required). Treat every database query like user input – because effectively, it is.
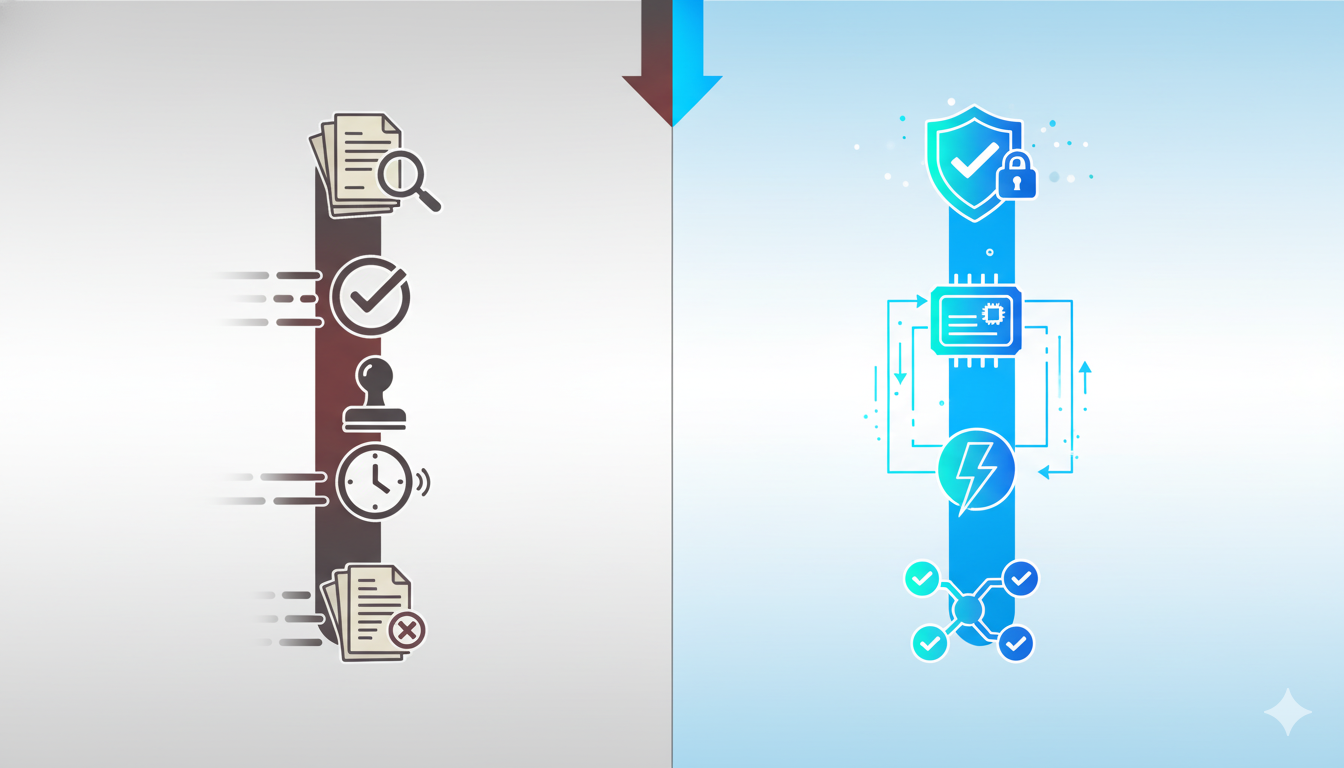
The 4-Stage Change Management Protocol That Could Have Prevented This
Test queries on production-scale data, validate output sizes before distribution, deploy to 1-5% of infrastructure first, maintain instant rollback.
Most organizations treat internal configuration changes differently than external inputs. That’s the fundamental mistake Cloudflare made here, and honestly, it’s a mistake almost everyone makes until something breaks. Their bot management system assumed that internally-generated files were inherently safe, so it skipped the validation checks that would catch oversized or malformed data. Actually, that assumption breaks down fast when you’re dealing with database queries that can return unpredictable output volumes.
Will this protocol prevent every possible failure? No. But it would have caught this specific issue in pre-production testing when the query first returned files 2-3x normal size.
Stage 1: Pre-Production Validation
Run queries against production-scale data in an isolated environment that mirrors your production architecture as closely as possible. Not sample data, not synthetic data – real production data or an anonymized dump that preserves volume and distribution characteristics.
Here’s what that looks like practically. Before deploying the ClickHouse permission change, engineers would: create a staging cluster with identical schema and similar data volume (doesn’t need to be 100% of production, but should be 50-80% minimum), execute the modified query against this staging cluster, examine output for anomalies – not just errors, but unexpected field counts, data types, or result sizes, and compare output to baseline from the current production query using automated diff tools.
The key insight? Staging environments are useless if they don’t reflect production scale. A query that returns 100 KB on 1 million rows might return 50 MB on 1 billion rows. The nonlinear scaling bites you.
Stage 2: Output Validation & Size Limits
Implement hard limits on query output before it reaches any downstream system. Think of this as input validation, but for internal data sources.
def validate_feature_file(file_content): “””Validate feature file before distribution””” MAX_SIZE_MB = 10 if len(file_content) > MAX_SIZE_MB * 1024 * 1024: raise ValidationError(f”File size {len(file_content)} exceeds limit”) try: parsed = json.loads(file_content) required_fields = [‘threat_rules’, ‘ip_ranges’, ‘metadata’] if not all(field in parsed for field in required_fields): raise ValidationError(“Missing required fields”) except json.JSONDecodeError: raise ValidationError(“Invalid JSON structure”) baseline_size = get_rolling_average_size(days=7) if len(file_content) > baseline_size * 1.5: log_warning(f”File size {len(file_content)} is anomalous”) return True
These checks run BEFORE distribution to edge servers. Cost of implementing this? Roughly 10-50ms added latency per feature file generation. Cost of not implementing it? Two hours of global outage.
Stage 3: Canary Deployment Strategy
Never roll changes to 100% of infrastructure simultaneously. Start small, monitor closely, expand gradually.
For configuration changes like feature file updates: Minutes 0-5 distribute new file to 1% of edge servers, Minutes 5-10 monitor error rates and memory usage at canary locations, Minutes 10-15 if metrics remain within thresholds expand to 10% of edge servers, Minutes 15-25 monitor broader deployment, and Minutes 25+ if all clear complete rollout to remaining 90%.
The critical part? Automated rollback triggers. If error rates exceed baseline by more than 10%, or if memory usage spikes more than 20%, or if latency increases more than 50% – automatic rollback, no human intervention required.
Stage 4: Kill Switch Architecture
Build the ability to instantly disable features at global or per-module level without deploying new code or restarting services. Two types matter: global feature flags (“turn off bot management file distribution entirely”) and per-module circuit breakers (“if any edge server fails to load a feature file 3 times consecutively, stop attempting”).
The cost of building this infrastructure? A few weeks of engineering time. The cost of not having it? Potentially massive, as Cloudflare just demonstrated.
So would these four stages have prevented the November 2025 outage entirely? Probably not “prevented” – the permission change would still have generated oversized files. But they absolutely would have contained the blast radius and shortened incident duration from 2 hours to maybe 15-20 minutes. That’s the realistic goal for infrastructure resilience. Not zero failures (impossible), but limited blast radius and rapid recovery (achievable).
🔥 DEVIL’S ADVOCATE: Is This Change Management Overkill for Small Teams?
✅ THE ARGUMENT: Bureaucracy kills velocity
Four-stage change management with pre-production validation, canary deployments, and kill switches sounds great for Cloudflare’s 300+ edge locations. But what about a startup with 5 engineers running a dozen microservices? Every hour spent on process is an hour not spent shipping features. Your competitors aren’t testing every database query in production-scale staging environments – they’re moving fast, iterating quickly, capturing market share while you’re conducting “15-minute dependency audits.”
⛔ THE COUNTER-ARGUMENT: One incident erases months of velocity
But here’s the math that kills that argument: Cloudflare’s 2-hour outage probably cost them more in customer trust, SLA credits, and incident response than they saved by skipping validation. Small teams actually have MORE reason to implement basic change management: can’t afford the reputational hit of major outages, don’t have deep bench for 3am incident response, customer churn is existential not just quarterly revenue blip.
Total overhead: 20-30 minutes per change. Cost of skipping: potentially days of incident response.
⚖️ THE VERDICT: Scale the process to your team size
The principle scales even if implementation doesn’t. For 5-person startups: test queries on realistic data, deploy during business hours when team available, one-click rollback capability, monitor 15 minutes after changes. For 500-person enterprises: full four-stage protocol, automated validation and rollback, comprehensive monitoring, dedicated SRE team. Good process enables velocity by preventing interruptions. What’s faster: 20 minutes validating a change, or 4 hours at 2am debugging a production incident?
Your 15-Minute Infrastructure Dependency Audit
Identify external dependencies (CDN, DNS, DDoS protection), map internal SPOFs (databases, caches, queues), trace data pathways, and assess recovery capabilities for each critical system.
Grab a notepad. Open your architecture diagrams. Set a timer for 15 minutes. We’re going to map every service that could take down your entire operation if it failed right now.
Most organizations discover their critical dependencies during outages, not before them. That’s expensive learning. Better approach: spend 15 minutes now identifying single points of failure than 2 hours tomorrow explaining to customers why everything’s broken.
Minutes 1-3: External Dependencies – List every third-party service your infrastructure relies on: content delivery, DNS resolution, DDoS protection, SSL/TLS certificates, payment processing, authentication, and monitoring/alerting. Write them down. Every single one.
Minutes 4-7: Internal Dependencies – Now map your internal architecture. Which systems are SPOFs? Databases, cache layers, message queues, background job processors, load balancers, internal APIs. For each system, ask: “If this disappeared right now, what percentage of functionality breaks?” 0-10% = acceptable risk, 10-50% = significant degradation, 50-90% = critical dependency, 90-100% = single point of failure URGENT attention required.
Minutes 8-11: Data Pathways – Trace how data flows through your infrastructure. Draw it out, mark the failure points. The Cloudflare incident showed us that even “distributed” systems have these chokepoints.
Minutes 12-15: Recovery Capabilities – For each critical dependency, answer: Can we detect failure within 60 seconds? Can we failover within 5 minutes? Can we operate degraded for 2 hours? If you answered “no” to any question for a 90-100% critical dependency, you’ve just identified your highest priority infrastructure project.
This audit will probably reveal 5-10 single points of failure you weren’t consciously aware of. That’s normal. Don’t try to eliminate every SPOF immediately – prioritize based on impact and feasibility. The goal isn’t perfect resilience (impossible). It’s conscious acceptance of specific risks versus unconscious accumulation of hidden dependencies.
Distributed Systems Resilience: Definition, Comparison, Application
🔹 DEFINITION: What “distributed” actually means
A distributed system spreads workload across multiple independent components – servers, data centers, geographic regions – so that no single component failure takes down the entire system. Cloudflare operates 300+ edge locations worldwide, making it extremely distributed geographically. But here’s what caught them: they had a shared configuration layer that affected all those locations simultaneously.
Distribution addresses component failures (server crashes, network partitions). It doesn’t automatically address shared dependencies – those require a different design pattern called “isolation” or “bulkheading.”
🔹 COMPARISON: Geographic vs logical distribution
Geographic distribution protects against regional failures: power outages, fiber cuts, natural disasters, regional internet issues. Cloudflare excels at this. Logical distribution protects against shared dependencies: databases, configuration systems, deployment pipelines, authentication services. This is where the November incident hit – a single database query affected every geographic location because they all relied on the same feature file generation system.
Most organizations assume geographic distribution provides complete resilience. Actually, the more dangerous failures come from logical dependencies that span your entire infrastructure.
🔹 APPLICATION: Why Cloudflare’s distribution wasn’t enough
The practical implication: when architecting resilient systems, map both your physical topology AND your logical dependencies. Ask: “If this database/queue/API fails, what percentage of my infrastructure breaks?” If the answer is “100%”, you’ve found a single point of failure that distribution doesn’t address. For Cloudflare, the fix isn’t more edge locations – it’s isolating the blast radius of configuration changes.
CDN Provider Reliability: Post-Incident Analysis
Every major CDN failed 2021-2025: Fastly (global), AWS (regional), Cloudflare (2 hours), Akamai (regional only). No provider is immune.
So what does this actually mean for your CDN selection decision? The uncomfortable truth is that reliability isn’t binary – it’s probabilistic. Cloudflare’s November incident was their second major outage in 18 months. Fastly had that spectacular global failure in June 2021 that took down Reddit, Amazon, CNN, and half the internet for nearly an hour. AWS has regional issues quarterly that affect CloudFront distribution. Even Akamai, the reliability champion with the longest track record, isn’t immune – though their incidents are less frequent and usually regional rather than global.
The real question isn’t “which provider never fails?” but rather “which failure modes can my business tolerate?” And increasingly, the answer for critical infrastructure is “none of them individually.”
Cloudflare vs Fastly vs Akamai vs AWS CloudFront
Let’s compare the major players based on their actual incident history, not marketing claims.
CDN Provider Incident History & Recovery (2021-2025)
| Provider |
Major Outages |
Avg MTTR |
Longest Incident |
Typical Impact |
Transparency |
| Cloudflare |
3 incidents |
1-2 hours |
2 hours (Nov 2025) |
15-20% of web |
⭐⭐⭐⭐⭐ Excellent |
| Fastly |
1 massive + 4 regional |
45-120 min |
49 min (Jun 2021) |
Up to 30% |
⭐⭐⭐⭐ Good |
| Akamai |
2 regional only |
15-30 min |
~30 min |
<5% typically |
⭐⭐⭐ Adequate |
| AWS CloudFront |
6+ regional |
30-240 min |
4+ hours |
Regional only |
⭐⭐ Variable |
CDN Provider Performance & Cost Comparison (10TB/month)
| Provider |
Latency (P95) |
Edge Locations |
TTFB |
Est. Cost |
| Cloudflare |
28ms |
300+ |
Fast |
~$600 |
| Fastly |
31ms |
70+ |
Fastest |
~$1,575 |
| Akamai |
26ms |
4,000+ |
Very Fast |
$3,000-5,000 |
| AWS CloudFront |
34ms |
450+ |
Good |
~$1,225 |
The price-to-reliability curve isn’t linear. Akamai costs 5-10x more than Cloudflare but doesn’t deliver 5-10x better uptime. What you’re paying for is longer track record, better enterprise support, more conservative change management, and contractual SLA guarantees with meaningful penalties.
Verdict: If you optimize for cost and integrated features – Cloudflare. If you need edge computing and real-time updates – Fastly. If you prioritize track record and can afford it – Akamai. If you’re committed to AWS ecosystem – CloudFront. But honestly? For any truly critical application, the right answer is probably “at least two of these.”
The Multi-CDN Strategy: When It Makes Sense
Running multiple CDN providers simultaneously sounds expensive and complex. It is. But for some use cases, it’s the only realistic way to achieve acceptable availability.
The Math: Let’s say each CDN provider has 99.9% uptime (roughly 8.75 hours of downtime per year). Single CDN: 99.9% availability = 8.75 hours downtime/year. Two CDNs with automatic failover: probability both are down simultaneously = 0.001 × 0.001 = 0.000001, uptime: 99.9999% = ~30 seconds downtime/year.
That’s the theoretical maximum. Reality is messier because failover isn’t instantaneous and some outages affect multiple providers. But even accounting for those factors, multi-CDN can realistically achieve 99.95-99.98% availability versus 99.9% for single provider.
Who Actually Needs This? Multi-CDN makes sense when financial impact of downtime is severe (e-commerce sites where 1 hour = $100k+ lost revenue), reputational risk is unacceptable (healthcare, government services), or geographic distribution requirements are extreme (truly global applications).
Multi-CDN probably doesn’t make sense if your revenue per hour of downtime is less than $10k, you’re a startup optimizing for feature velocity, your traffic is primarily regional, or your team lacks expertise to manage multi-CDN complexity.
Economic breakeven: For typical mid-sized site (50 TB/month), single CDN costs ~$2,500/month, multi-CDN active-passive ~$3,025/month (1.2x cost), multi-CDN active-active ~$5,050/month (2x cost). Calculate your hourly downtime cost. If it exceeds $10,000, multi-CDN pays for itself after preventing just one 2-hour incident per year.
ClickHouse in Production: Lessons from Cloudflare’s Mistake
Column-oriented databases like ClickHouse deliver 10-100x faster analytics compared to traditional row-oriented systems – but that performance comes with hidden complexity that bit Cloudflare hard.
The architecture makes intuitive sense: store data by column rather than by row, compress similar values efficiently, read only the columns your query needs. When you’re asking “how many requests from this IP range in the last hour?” you don’t need entire rows – just IP addresses and timestamps. ClickHouse reads those two columns, ignores everything else, and returns results blazingly fast.
But here’s what the benchmarks don’t show: column-oriented systems have more complex query planners, more ways for queries to return unexpected results, and more opportunities for permission changes to have non-obvious effects. The specific failure mode Cloudflare experienced – a query returning metadata alongside data after a permission change – is less likely with simpler row-oriented databases.
Does that mean ClickHouse was the wrong choice? Actually, no. For Cloudflare’s use case – analyzing billions of bot detection events in real-time – ClickHouse remains the correct architecture. But it requires additional safeguards that weren’t initially present.
Column-Oriented vs Row-Oriented: When to Use Each
The choice between column-oriented and row-oriented databases isn’t about “better” or “worse” – it’s about matching architecture to workload characteristics.
Choose Column-Oriented When: Analytical queries over billions of rows, queries typically read 10-20% of columns and 80%+ of rows, heavy aggregations (COUNT, SUM, AVG) over time ranges, write-once read-many access patterns, you have engineers with specialized database expertise, compression ratio matters.
Choose Row-Oriented When: Transactional workloads with frequent updates, queries need most columns from relatively few rows, ACID guarantees are critical, your team lacks specialized database expertise, simpler failure modes are worth the performance trade-off.
For Cloudflare’s bot detection use case, ClickHouse was correct: billions of request logs per hour, queries like “show me all requests from ASN X matching pattern Y in the last 15 minutes”, aggregations across time windows, write-once data, need for real-time insights. PostgreSQL would have struggled with this volume and query pattern. The problem wasn’t the database choice – it was insufficient validation around query changes and insufficient blast radius containment when queries produced unexpected results.
🔥 DEVIL’S ADVOCATE: Should Enterprises Self-Host CDN Instead?
✅ THE ARGUMENT: You control your own fate
After watching Cloudflare, Fastly, and AWS all experience major outages, a reasonable question emerges: why not just build your own CDN infrastructure? The technology isn’t magical. Open-source software exists. Netflix does this with Open Connect. Facebook built their own edge network. Google operates YouTube’s delivery infrastructure entirely self-hosted. If the world’s largest internet properties don’t trust commercial CDNs, why should you?
⛔ THE COUNTER-ARGUMENT: You also own your own failures
But here’s the painful reality: Netflix, Facebook, and Google employ thousands of infrastructure engineers. Their CDN teams are larger than most companies’ entire engineering departments. When your self-hosted CDN breaks at 3 AM, you have your on-call engineer, probably Googling error messages while panicking.
The economics only work at massive scale. To match Cloudflare’s global coverage (300+ POPs): server costs $50k+ per POP × 300 = $15M+ in hardware, bandwidth negotiations with ISPs globally, staffing 10-20 engineers minimum = $2-4M/year, DDoS mitigation infrastructure. Total cost: $20M+ upfront, $5-10M/year ongoing. Versus Cloudflare Enterprise: $20k-100k/year depending on volume.
The break-even point is around 500 TB/month of traffic. Below that, commercial CDN is cheaper.
⚖️ THE VERDICT: Scale and expertise dependent
Self-host if: traffic exceeds 500 TB/month consistently, you have 5+ dedicated infrastructure engineers with CDN expertise, your use case requires deep customization, vendor lock-in risk outweighs operational complexity. Use commercial CDN if: traffic is less than 500 TB/month, your engineering team is fewer than 50 people total, you need features like DDoS protection and bot management, you want predictable costs without capital expenditure.
For 95% of organizations reading this article, the answer is clear: use commercial CDN and implement multi-CDN strategy for critical applications. Building your own is a distraction from core business unless you’re operating at truly massive scale.
What This Means for IPv4 Infrastructure Management
The Cloudflare incident offers direct lessons for organizations managing network infrastructure at the IP layer – particularly those working with IPv4 address allocations, transfers, and routing.
At InterLIR, we facilitate IPv4 address transfers between organizations through regional internet registries (RIPE NCC, ARIN, APNIC, LACNIC, AFRINIC). The reliability requirements parallel what Cloudflare faces: our customers depend on accurate, always-available data about IP address allocations, reputation scores, and transfer status. A two-hour outage in our systems would freeze thousands of dollars in pending transactions and damage trust with both buyers and sellers.
Database Reliability: Just as Cloudflare uses ClickHouse to analyze billions of bot detection events, we use PostgreSQL to track hundreds of thousands of IPv4 address blocks, their ownership history, transfer records, and reputation data. Our safeguard: every database query has explicit row limits, execution time limits, and output size validation before returning results to the application layer.
External Dependency Management: Cloudflare depended on their feature file generation system. We depend on RIR APIs for real-time transfer validation. When RIPE NCC’s API experiences issues – which happens several times per year – we can’t validate European IPv4 transfers in real-time. Our solution mirrors the multi-CDN strategy: we cache RIR data locally, maintain relationships with multiple registries, and have manual verification workflows that activate when APIs are unavailable.
Change Management for Network Configuration: BGP routing configuration changes are analogous to Cloudflare’s database permission changes – both are “routine operations” that can have catastrophic consequences if misconfigured. When organizations transfer large IPv4 blocks, they often need to update BGP announcements, AS-SET objects, and routing policies simultaneously. A mistake here can black-hole traffic to thousands of IP addresses.
The discipline required: test announcements in looking glass servers before production, gradual rollout (announce from one router, verify propagation, expand), peer notification (inform major peering partners of upcoming changes), rollback plan (old configuration saved, one-command revert), and monitoring (watch BGP propagation globally, alert on unexpected de-aggregation).
The IPv4 address space is finite and increasingly valuable (blocks trade at $40-50 per IP currently). Organizations that depend on stable, reliable IP infrastructure can’t afford to learn these lessons the hard way. Whether you’re operating a global CDN or managing a /16 network block, the principles remain constant: validate everything, contain blast radius, plan for failure, recover quickly.
Your Next Steps: From Reading to Action
You’ve just consumed 6,000+ words analyzing a major internet infrastructure failure. But analysis without action is just entertainment. Here’s your priority-ordered checklist.
1️⃣ Priority 1: Complete Dependency Audit (Today – 15 minutes) – Open your architecture diagrams right now. Identify your top 3 single points of failure – services where 90%+ of functionality breaks if they’re unavailable. Write them down. Schedule a meeting this week to discuss redundancy options. If you’re thinking “I’ll do this later,” remember that Cloudflare probably had “add more validation to feature file generation” on a backlog somewhere.
2️⃣ Priority 2: Review Change Management (This Week – 2 hours) – Pull up your last 10 production incidents. How many originated from internal changes versus external attacks? If the answer is more than 50% internal, you need better change management. Specifically: Do database queries get tested against production-scale data? Do configuration changes go through canary deployment? Can you rollback any change in under 5 minutes? If you answered “no” to any of these, that’s your next engineering project.
3️⃣ Priority 3: Evaluate Multi-Provider Strategy (This Month – 4 hours) – Calculate your actual cost of downtime. Not hand-wavy estimates – actual dollars per hour. If that number exceeds $10k/hour, you should seriously investigate multi-CDN or multi-provider strategies for critical dependencies.
4️⃣ Priority 4: Implement Monitoring Gaps (This Quarter – Ongoing) – Cloudflare’s monitoring tracked system resources but missed the metric that actually mattered: feature file size over time. Review your monitoring. Are you tracking derived metrics (not just “database response time” but “query result size”), business metrics (not just “HTTP 200s” but “successful checkouts”), and negative metrics (not just “errors” but “missing expected events”)? The best monitoring catches problems before they become outages.
A Final Thought from InterLIR:
We’ve spent years helping organizations navigate the complexities of IPv4 address management, transfers, and network infrastructure. The parallel lesson from our work: reliability isn’t about preventing all failures – that’s impossible. It’s about containing failures, recovering quickly, and learning systematically.
Every organization has limited resources. You can’t eliminate every risk. But you can be deliberate about which risks you accept versus which you mitigate.
Cloudflare’s November 2025 outage disrupted 20% of the internet for 2 hours because a database permission change wasn’t properly validated before deployment. That’s a $100M+ lesson delivered at Cloudflare’s expense. Don’t waste it.
The internet’s infrastructure may be complex and sometimes fragile, but with proper planning, monitoring, and response procedures, organizations can build resilience into their operations and minimize impact when inevitable disruptions occur.
Whether you’re managing a global CDN, operating a regional ISP, or securing IPv4 address blocks for your growing business, the principles remain the same: validate everything, contain blast radius, plan for failure, recover quickly, learn relentlessly.
Now close this article and go audit your infrastructure. You have 15 minutes.
❓ Frequently Asked Questions
Q: Could this outage have been prevented?
A: Yes, through stricter change management. The specific failure mode – database query returning oversized output – would have been caught in pre-production testing if engineers had validated the query against production-scale data before deployment. The four-stage protocol outlined in this article would have prevented the global impact. Cloudflare has committed to implementing these exact safeguards as part of their remediation plan.
Q: Should I switch away from Cloudflare after this incident?
A: Not necessarily – and probably not based solely on this incident. Every major CDN provider has experienced significant outages in recent years: Fastly (June 2021 global outage), AWS CloudFront (multiple regional incidents quarterly), Cloudflare (November 2025 plus previous incidents), Akamai (regional issues only, but at 3-5x higher cost). The question isn’t “which provider never fails” but rather “which failure modes can my business tolerate and what’s my contingency plan?” For organizations where 2 hours of degraded service costs less than the additional expense of multi-CDN redundancy, staying with Cloudflare after they implement their remediation plan is reasonable.
Q: How long did the outage actually last?
A: Approximately 2 hours total, from 11:20 UTC when first edge node failures were detected until just before 13:00 UTC when full service restoration was confirmed. However, the impact wasn’t uniform. The intermittent nature – systems working normally for 4-5 minutes between crashes – meant some users experienced only occasional errors while others couldn’t access Cloudflare-protected sites at all, depending on timing and geography.
Q: What is ClickHouse and why did Cloudflare use it?
A: ClickHouse is a column-oriented database management system developed by Yandex and now open-source. It’s optimized for OLAP (Online Analytical Processing) workloads – queries that read many rows but relatively few columns, then aggregate the results. For Cloudflare’s bot management use case, they’re analyzing billions of request logs to identify malicious patterns. Column-oriented databases like ClickHouse make these queries 10-100x faster than traditional databases like PostgreSQL or MySQL. The database itself worked perfectly – it correctly returned all the data the query requested. The issue was insufficient validation around what the query requested and whether downstream systems could handle the output volume.
Q: What percentage of the internet was actually affected?
A: Cloudflare services approximately 20% of all websites globally according to third-party estimates. During the outage, not all services failed simultaneously or completely. The specific issue affected the bot management system’s feature file distribution, which cascaded to proxy server crashes. The intermittent nature (crash to recover to crash every 5 minutes) meant impact varied: some websites experienced complete unavailability, others saw intermittent errors, sites using only Cloudflare DNS weren’t affected, and sites with origin failover rules may have automatically bypassed Cloudflare.
Q: What is a multi-CDN strategy and when does it make sense economically?
A: A multi-CDN strategy means using two or more CDN providers simultaneously rather than depending on a single provider. Active-Active splits traffic between providers (e.g., 50% Cloudflare, 50% Fastly) with instant failover. Active-Passive uses primary CDN for 95%+ of traffic with secondary on standby, failover takes 5-15 minutes. For typical mid-sized site (50 TB/month): single CDN costs ~$2,500/month, multi-CDN active-passive ~$3,025/month (1.2x cost), multi-CDN active-active ~$5,050/month (2x cost). Calculate your hourly downtime cost. If it exceeds $10,000, multi-CDN pays for itself after preventing just one 2-hour incident per year.
🌐 IPv4 Marketplace & LIR Services
GLOBAL IP ADDRESS SOLUTIONS
Professional broker services for secure IP transfers, reputation-clean address blocks, and LIR support across all regional registries.
📚 Related Articles You Might Find Useful