As we navigate through 2025, the global Internet routing infrastructure has reached a critical milestone that demands attention from network operators, businesses, and IT professionals worldwide. At InterLIR, where we specialize in IPv4 address marketplace solutions, we’ve been closely monitoring these developments as they directly impact our clients’ network planning and resource allocation strategies. The latest data from the Weekly Global IPv4 Routing Table Report reveals that the BGP routing table has surpassed 1 million entries, marking a significant evolution in Internet backbone complexity.
This comprehensive analysis examines the current state of the IPv4 routing ecosystem, exploring what these numbers mean for businesses operating in an increasingly connected world. As someone who works daily with organizations navigating IPv4 address scarcity and routing challenges, I’ve witnessed firsthand how these technical metrics translate into real-world business decisions and infrastructure investments.
The global IPv4 routing table now contains 1,012,261 prefixes as of November 2025, representing a watershed moment in Internet infrastructure evolution. This figure isn’t just a technical statistic-it reflects the cumulative result of decades of Internet growth, business expansion, and the fundamental challenge of managing a finite resource that has reached its allocation limits.
From our perspective at InterLIR, this milestone carries significant implications for organizations seeking to establish or expand their network presence. The routing table’s growth directly impacts router memory requirements, processing capabilities, and ultimately, the cost of maintaining robust Internet connectivity. When we consult with clients about IPv4 address acquisitions, understanding these routing dynamics helps us provide more strategic guidance about prefix sizing and announcement strategies.
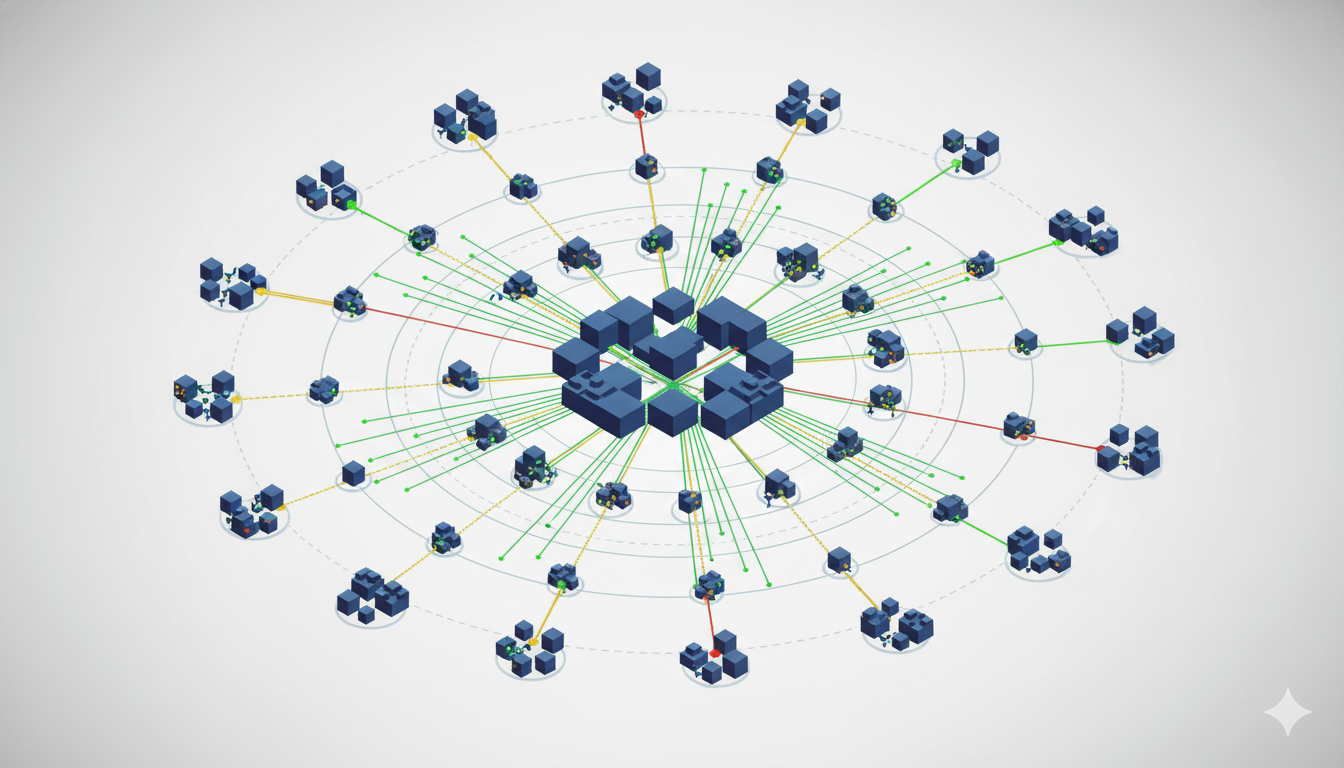
BGP routing table growth visualization showing global prefix distribution and aggregation metrics
The current routing landscape presents several critical metrics that network operators must consider:
Total BGP routing table entries: 1,012,261 prefixes representing the complete global routing picture
Maximum aggregation potential: 392,668 prefixes per Origin AS, indicating a deaggregation factor of 2.58
RPKI-validated prefixes: 580,581 routes (57.4%) have valid Route Origin Authorizations
Security gaps: 430,157 prefixes (42.5%) lack ROA protection, representing ongoing security vulnerabilities
Invalid ROAs: 1,523 prefixes (0.15%) with configuration issues requiring immediate attention
The deaggregation factor of 2.58 is particularly noteworthy. This metric indicates that the actual number of routing table entries is more than 2.5 times what would be necessary if all prefixes were maximally aggregated. While deaggregation serves legitimate purposes-traffic engineering, multihoming, and redundancy-it also contributes to routing table bloat that affects every router on the Internet.
The report identifies 77,510 Autonomous Systems present in the global routing table, each representing an independent network operator with its own routing policies and business objectives. This diversity is both a strength and a challenge for the Internet ecosystem. At InterLIR, we work with organizations across this spectrum, from enterprises acquiring their first AS number to established operators expanding their routing footprint.
The distribution of these autonomous systems reveals fascinating insights about Internet operations:
Origin-only ASes: 66,548 networks (85.9%) that announce routes but don’t provide transit services
Transit providers: 10,962 ASes (14.1%) that carry traffic between other networks
Pure transit ASes: 545 networks (0.7%) dedicated exclusively to providing connectivity
Single-prefix operators: 27,117 ASes (35%) announcing just one prefix, often representing smaller enterprises or specialized services
The average AS path length of 4.7 hops indicates that most Internet traffic traverses approximately five different networks between source and destination. However, the maximum observed path length of 57 hops-with ASN 37447 showing an AS path prepend of 53-demonstrates extreme traffic engineering practices that some operators employ to influence routing decisions.
The evolution toward 32-bit Autonomous System Numbers continues to progress, addressing the exhaustion of the original 16-bit AS number space. Currently, 47,936 32-bit ASNs have been allocated by Regional Internet Registries, with 39,257 (81.9%) visible in the global routing table. These newer ASNs now originate 215,103 prefixes, representing 21.2% of all announced routes.
For organizations planning network expansions, this transition is largely transparent but represents an important consideration for legacy equipment compatibility. When we assist clients with IPv4 address transfers at InterLIR, we ensure they understand how their routing infrastructure will interact with both 16-bit and 32-bit ASN environments.
One of the most revealing aspects of the routing table analysis is the significant variation across Regional Internet Registry territories. These differences reflect distinct development trajectories, regulatory environments, and market structures that shape how the Internet operates in different parts of the world.
| Region | Prefixes | Deaggregation | Origin ASes | Prefixes/ASN | Address Space (/8 equiv) |
|---|---|---|---|---|---|
| APNIC (Asia-Pacific) | 271,861 | 3.36 | 14,871 | 17.59 | 44.7 |
| ARIN (North America) | 297,841 | 2.23 | 19,375 | 15.38 | 80.2 |
| RIPE (Europe) | 281,173 | 2.02 | 29,099 | 9.68 | 43.9 |
| LACNIC (Latin America) | 125,439 | 4.08 | 11,311 | 10.74 | 10.2 |
| AfriNIC (Africa) | 34,992 | 5.05 | 1,983 | 24.67 | 6.1 |
These regional patterns tell compelling stories about Internet development and resource distribution:
The APNIC region demonstrates high consolidation with an average of 17.59 prefixes per ASN, reflecting the presence of large telecommunications operators serving massive populations. China Mobile alone announces 13,466 prefixes, illustrating the scale of network operations in Asia-Pacific markets. The deaggregation factor of 3.36 suggests moderate route fragmentation, balancing operational flexibility with routing efficiency.
The ARIN region controls the largest address space allocation at 80.2 equivalent /8 blocks, a legacy of early Internet development concentrated in North America. With a relatively low deaggregation factor of 2.23, ARIN networks demonstrate more efficient routing practices. Amazon’s dominance with 14,312 announced prefixes highlights the growing influence of cloud service providers in global Internet infrastructure.
The RIPE region exhibits the most distributed network operator landscape with 29,099 origin ASes and the lowest deaggregation factor of 2.02. This efficiency reflects mature Internet governance practices and well-established routing policies across European networks. The lower prefixes-per-ASN ratio of 9.68 indicates a more fragmented operator landscape with numerous smaller networks.
The LACNIC region shows a higher deaggregation factor of 4.08, suggesting more aggressive route splitting for traffic engineering purposes. Telmex Mexico’s announcement of 12,504 prefixes demonstrates the concentration of Internet infrastructure among major telecommunications providers in Latin America. The region’s smaller address space allocation of 10.2 equivalent /8s reflects later Internet adoption and development.
The AfriNIC region presents the highest deaggregation factor at 5.05 and the highest prefixes-per-ASN ratio of 24.67, indicating both significant route fragmentation and concentration among fewer operators. With only 6.1 equivalent /8s of address space and 1,983 origin ASes, Africa’s Internet infrastructure remains the least developed globally, though it’s experiencing rapid growth.
The most critical finding from the routing table analysis is the confirmation of complete IPv4 address space exhaustion. The numbers are stark and unambiguous:
Addresses announced: 3,103,608,960 IPv4 addresses actively routed
Available space announced: 83.8% of the theoretical maximum
Allocated space announced: 83.8% of all allocated addresses
Available space allocated: 100.0%-complete exhaustion
Address space in active use: 99.6% utilized by end-sites
At InterLIR, we’ve witnessed this exhaustion transform the IPv4 marketplace from a theoretical concern into a practical reality affecting daily business operations. With 100% of available IPv4 address space now allocated and 99.6% in actual use, organizations can no longer obtain new IPv4 addresses directly from Regional Internet Registries. Instead, they must participate in the secondary market, acquiring addresses through transfers from existing holders.
This reality has several important implications for network planning and business strategy. First, IPv4 addresses have become valuable assets with real market value, requiring careful management and strategic allocation. Second, organizations must balance their immediate IPv4 needs against long-term IPv6 transition planning. Third, the scarcity of IPv4 resources makes efficient address utilization and routing practices more critical than ever.
The report identifies 332,336 prefixes smaller than registry allocations, representing significant route deaggregation. While this practice serves legitimate operational purposes-enabling multihoming, traffic engineering, and redundancy-it contributes to routing table growth that affects all Internet participants.
From a business perspective, deaggregation decisions involve trade-offs between operational flexibility and community impact. Organizations announcing more specific prefixes gain finer control over traffic routing but contribute to the global routing table’s growth, increasing memory and processing requirements for routers worldwide. When advising clients at InterLIR, we help them understand these trade-offs and develop routing strategies that balance their operational needs with responsible Internet citizenship.
The concentration of routing announcements among major providers reveals important trends in global Internet infrastructure. The top five autonomous systems by prefix count demonstrate the scale of modern network operations:
| Rank | ASN | Organization | Prefixes | Region |
|---|---|---|---|---|
| 1 | 16509 | Amazon | 14,312 | North America |
| 2 | 9808 | China Mobile | 13,466 | Asia-Pacific |
| 3 | 8151 | Uninet (Telmex) | 12,504 | Latin America |
| 4 | 12479 | UNI2-AS | 7,287 | Europe |
| 5 | 7545 | TPG Telecom | 6,094 | Asia-Pacific |
Amazon’s position at the top of this list is particularly significant, representing the growing dominance of cloud service providers in global Internet infrastructure. As businesses increasingly migrate workloads to cloud platforms, these providers’ routing footprints expand correspondingly. This trend has important implications for Internet resilience, as more traffic flows through fewer large networks.
Each region’s leading operator reflects local market dynamics and historical development patterns. China Mobile’s massive presence in APNIC, Telmex’s dominance in LACNIC, and the more distributed landscape in RIPE all tell stories about telecommunications regulation, market competition, and infrastructure investment in their respective regions.
Resource Public Key Infrastructure (RPKI) represents one of the most important developments in routing security, providing cryptographic validation of route origins to prevent BGP hijacking and route leaks. The current adoption statistics show both progress and persistent challenges:
Valid ROA coverage: 580,581 prefixes (57.4%) properly secured
No ROA protection: 430,157 prefixes (42.5%) remain vulnerable
Invalid ROAs: 1,523 prefixes (0.15%) with configuration errors
Unregistered ASNs: 955 prefixes from unregistered autonomous systems
Bogon ASNs visible: 106 instances of reserved ASNs in the routing table
Unallocated address space: 416 prefixes from addresses not officially allocated
While achieving 57.4% RPKI coverage represents significant progress, the 42.5% of prefixes without ROA protection represents a substantial security gap. These unprotected routes remain vulnerable to hijacking, where malicious actors could announce unauthorized routes and intercept traffic destined for these addresses.
At InterLIR, we strongly advocate for RPKI adoption among our clients. When facilitating IPv4 address transfers, we encourage both sellers and buyers to implement proper ROA configurations, contributing to overall Internet security. The small percentage of invalid ROAs (0.15%) typically results from configuration errors during address transfers or network changes, highlighting the importance of proper RPKI maintenance procedures.
The presence of 416 prefixes from unallocated address space is particularly concerning, representing either administrative errors or deliberate misuse of unassigned resources. These anomalies underscore the ongoing need for vigilant monitoring and enforcement of routing policies by network operators and Internet governance bodies.
The findings from this comprehensive routing table analysis carry important implications for various stakeholders in the Internet ecosystem. Based on our experience working with diverse organizations at InterLIR, I can offer practical perspectives on how these technical metrics translate into business decisions and operational strategies.
With over 1 million prefixes in the global routing table, organizations must ensure their routing infrastructure can handle current and future demands. This requirement affects several aspects of network planning:
Router memory capacity: Modern routers must accommodate the full routing table plus growth headroom, typically requiring substantial memory investments
Processing capabilities: Route computation and convergence times increase with routing table size, necessitating more powerful routing processors
Redundancy planning: Multiple routing table copies across redundant routers multiply memory and processing requirements
Upgrade cycles: Routing table growth drives more frequent infrastructure refresh cycles, impacting capital expenditure planning
Complete IPv4 exhaustion fundamentally changes how organizations approach address space acquisition and management:
Secondary market participation: Organizations must engage with IPv4 brokers and marketplaces like InterLIR to acquire needed addresses
Asset valuation: IPv4 addresses represent balance sheet assets requiring proper valuation and management
Efficient utilization: Scarcity demands maximizing address space efficiency through technologies like NAT and careful subnet design
Transfer planning: Address acquisitions require understanding RIR transfer policies and routing implications
The routing security landscape demands proactive measures from responsible network operators:
RPKI deployment: Implementing ROA validation protects both your own routes and helps secure the broader Internet
Route filtering: Proper prefix filtering prevents bogon announcements and limits routing table pollution
Monitoring systems: Continuous monitoring detects unauthorized route announcements and potential hijacking attempts
Incident response: Established procedures for responding to routing security incidents minimize business impact
While IPv4 exhaustion is complete, IPv6 adoption remains uneven and gradual. Organizations must develop dual-stack strategies that maintain IPv4 connectivity while progressively implementing IPv6:
Parallel deployment: Running IPv4 and IPv6 simultaneously during the extended transition period
Application readiness: Ensuring all applications and services support IPv6 connectivity
Training investment: Building team expertise in IPv6 routing, addressing, and troubleshooting
Vendor coordination: Working with partners and vendors to ensure IPv6 support across the technology stack
The global IPv4 routing table’s evolution past 1 million prefixes represents more than a technical milestone-it reflects the Internet’s maturation into a critical infrastructure supporting virtually all modern business operations. The complete exhaustion of IPv4 address space, combined with the routing table’s continued growth and fragmentation, creates both challenges and opportunities for organizations worldwide.
At InterLIR, we’ve built our business around helping organizations navigate this complex landscape. The regional variations in routing practices, the concentration of infrastructure among major providers, and the ongoing security challenges all influence how businesses should approach their network planning and IPv4 resource management. Understanding these dynamics enables more strategic decision-making about address acquisitions, routing policies, and infrastructure investments.
The progress in RPKI adoption, while encouraging, highlights that routing security remains a shared responsibility requiring continued commitment from all Internet stakeholders. Similarly, the persistence of routing anomalies and the high deaggregation factors in some regions indicate ongoing opportunities for improving routing efficiency and Internet governance.
As we continue through 2025 and beyond, the trends evident in this routing table analysis will shape Internet infrastructure development for years to come. Organizations that understand these dynamics and plan accordingly will be better positioned to maintain robust, secure, and cost-effective network operations in an increasingly connected world. The IPv4 marketplace will remain active and essential even as IPv6 adoption gradually progresses, making informed resource management and strategic planning more critical than ever.
For network operators, businesses, and IT professionals, staying informed about routing table trends and their implications isn’t just about technical knowledge-it’s about making sound business decisions in a resource-constrained environment. The data presented in these routing table reports provides valuable insights for anyone responsible for network infrastructure, security, or strategic planning in our interconnected digital economy.

Evgeny Sevastyanov
Support Team Leader

A Beginner’s Guide to Subnetting IPv4 and IPv6 Addresses Subnetting is a critical

Why IPv4 Leasing Is Becoming the Smart Choice for Businesses in 2025 1. Introduction
As CEO of InterLIR, I’ve witnessed firsthand how network isolation strategies

What is an ASN? ASN stands for Autonomous System Number. It is a unique identifier

Anycast DNS: A Leader’s Guide to Protecting Your Digital Infrastructure Executive

RPKI Certification: A Leader’s Guide to Internet Routing Security Executive

Executive Summary: What You Need to Know 🎯 Strategic Importance – Internet

When AWS DynamoDB failed in October 2025, thousands of businesses discovered that

Executive Summary: What You Need to Know 🎯 IP reputation directly impacts your
Mastering Subnetting and Routing for Modern Networks Why Subnetting Matters in Today’s